Countries want to build digital twins. Almost none of them have the geospatial layers to do it.
The layers usually exist somewhere. They are just in the wrong state. Trapped in paper-based formats. Stuck in time, accurate as of whenever the last survey ran. Or they cover a small enough subset of datapoints that you end up extrapolating the entire country from one dense patch, which falls apart fast anywhere with diverse landscapes and diverse people. Those are exactly the countries that need a national digital twin most.
So we turned to a sensor that already exists. The network.
Second thing. Developers want to use advanced 3D simulation and modeling and do not have the GPU hardware. The whole tooling stack now assumes a cluster you do not have, which quietly locks out most of the people who would actually build with this. We made it run on any hardware instead, and benchmarked it CPU-only all the way down to a Raspberry Pi. Slowly. But it runs.
Third thing, and this is the one that makes me tired. Skill and capacity are genuinely short in a lot of places, and into that gap walk companies from the Global North, pitching organizations on methods built for very different starting circumstances. High-resolution remote sensing and satellite data, ranging from 3D renders of buildings from LiDAR, to sensors deployed nationwide. Ability to use public cloud infrastructure and services. Nobody in the room asking who owns the data afterwards. Those methods do not survive contact with the real problem, and the pitch decks never say so.
So the paper, the methodologies and the benchmark datasets are open sourced and free. Not as a gesture. A three person team in a ministry should be able to check our work.
Sensing you already own, on hardware you already have, using methods you can pull apart and check yourself.
Zambales, and the computer you had to rent
The internet cost twenty pesos an hour and I remember rationing it.
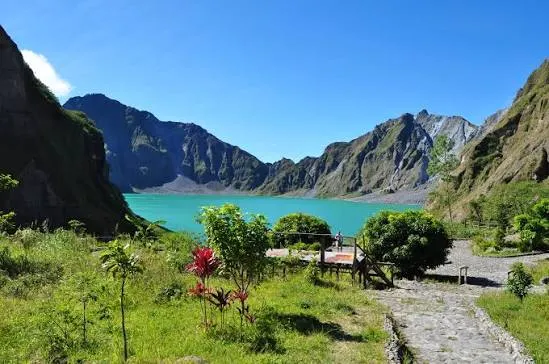
I grew up in Zambales, on the western coast of Luzon, which is the kind of place where the weather is not small talk. It decides things. Typhoon season reorganizes your year. And the whole province sits in the shadow of Mt. Pinatubo, so the lahar plains are just part of the landscape you drive past, this enormous grey record of what happens when a mountain rearranges a province and the rivers spend the next decade deciding where to go.
Press enter or click to view image in full size
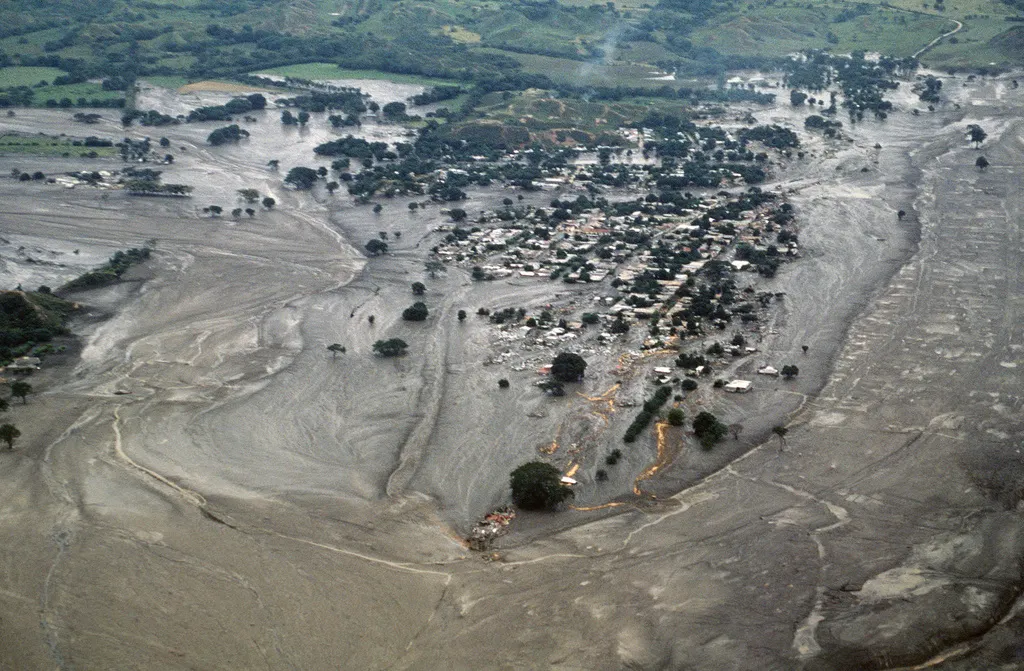
Source: NARA and DVIDS Public Domain Archives
You grow up around that and geophysics stops being a school subject. It is the thing that owns your address.
The internet cafe is the other half of the story. I could not simulate anything at home. So I would walk over, pay for an hour, and spend most of it reading Wikipedia about volcanoes and river systems and, honestly, whatever the “random article” button gave me. Then I would spend the remaining twenty minutes on the actual thing I wanted, which was building worlds.
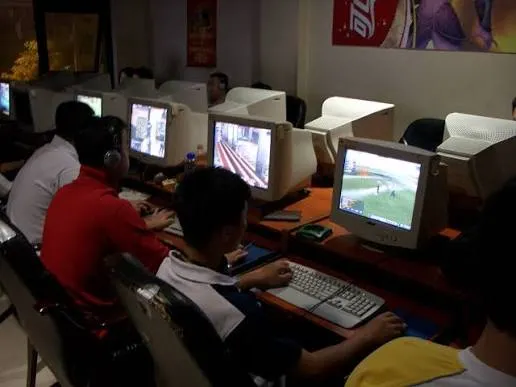
The Sims. Ragnarok. World of Warcraft. Animal Crossing. Later, RimWorld. Anything where you get handed terrain and have to make a place out of it.
I was obsessed with one specific quality of those games, and it took me years to name it. The environment is not scenery. It is a system, and it writes the story.
In Cities Skylines you can poison your own city by putting the sewage outflow upstream of the water pump, and nobody tells you, you just watch the little green cloud drift down the river and reach your intake and your citizens start dying and it is entirely your fault. In Animal Crossing the tide and the season and the hour decide who shows up and what you can catch. In The Sims the layout of a house quietly determines whether your character ever meets anybody.
Change the world, and the world changes the story back.
That is the whole idea. I have been building digital twins since I was nine. I just called it playing.
The gap that made me stop playing
Minutes to decide. Hours to know.
A storm surge arrives in minutes. The data a minister needs to call an evacuation arrives in hours, and sometimes days. Sit with that arithmetic for a second, because everything else in this post comes out of it.
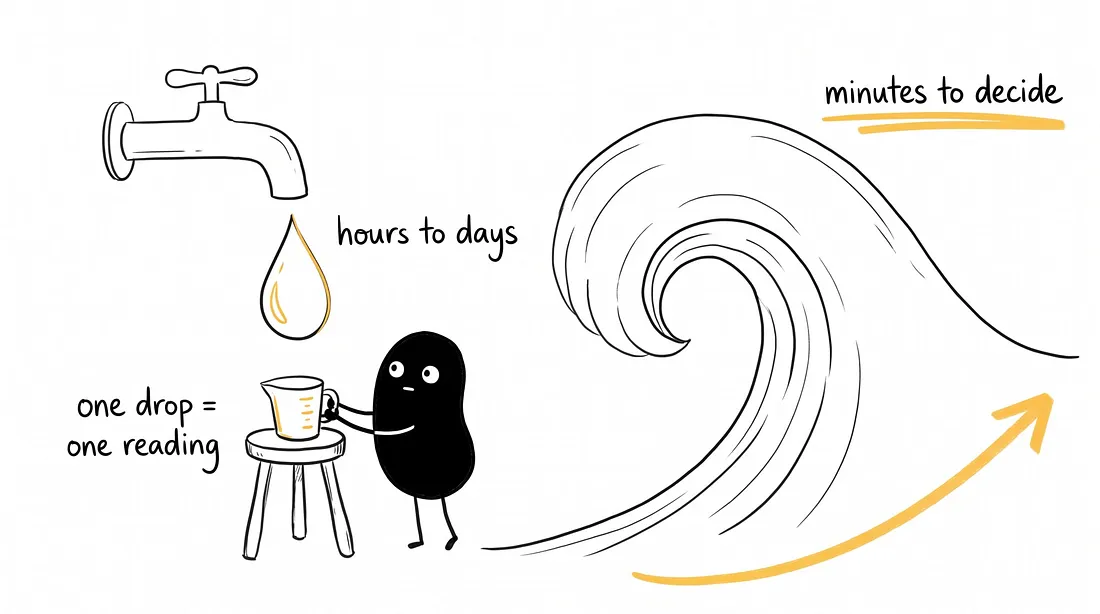
It is not a modeling problem or a policy problem. The country cannot see fast enough.
And the countries with the worst version of it are the ones least able to fix it the obvious way. Small island developing states sit right at the front of sea level rise and stronger cyclones. They are also some of the most weakly instrumented (i.e., least number of weather stations) places on earth. Weather radar, tide gauges, river sensors, all expensive, all fragile in exactly the conditions you bought them for.
The standard advice is to go buy a few thousand more sensors.
Which is the one thing the budget will never do. Every person who has ever written a national adaptation plan knows this and writes it anyway.
Nobody is listening to what comes back
Radio waves already bounce off everything. Buildings, hills, rain cells, moving objects, all of it, constantly.
A mobile network floods a country with radio energy twenty four hours a day so people can watch videos and call their mother. Those waves are already touching the environment. They come back changed. And we throw all of that away.
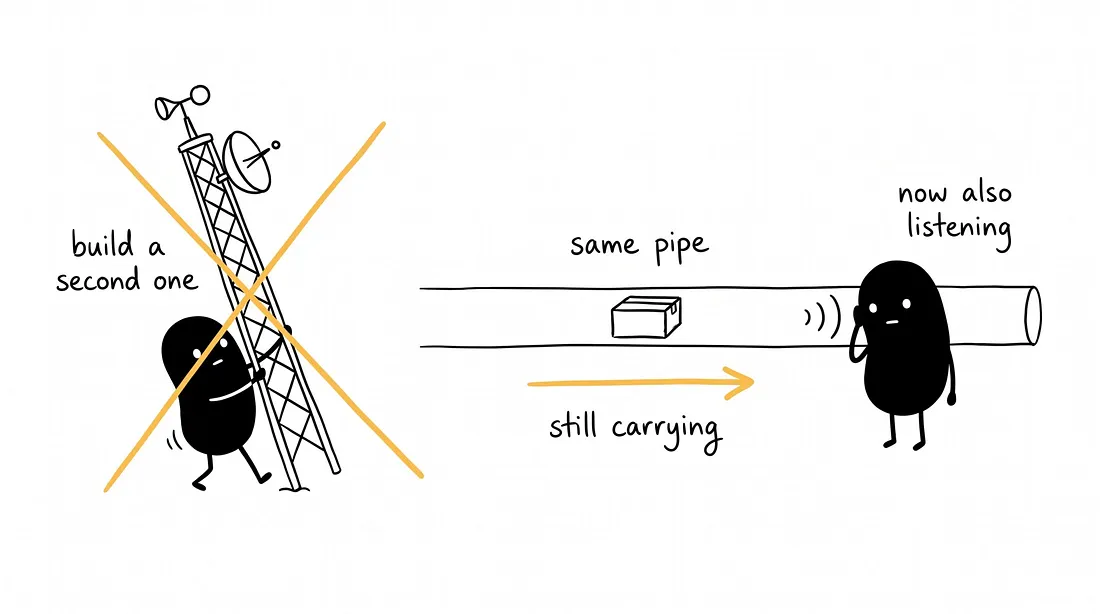
Sixth generation (6G) mobile adds the listening. The term is “ISAC”, Integrated Sensing And Communication, and at the physical layer it shows up as Dual Function Radar Communication. One base station, one waveform, two jobs. Carry the data, and hand back radar grade observables at the same time. Range, angle of arrival, Doppler velocity, micro structure.
For a country of 166 square kilometers with a tight budget, that reshapes the entire problem. You do not fund a second national sensing estate. Every tower you were already going to build becomes a hazard instrument. Sensing stops being a capital programme and becomes a software and spectrum feature of connectivity rollout.
We call it the Network-as-a-Sensor. The network ends up wearing three hats at once.
- Infrastructure the twin models,
- backbone carrying the twin’s data, and
- distributed sensor feeding the twin.
ETSI published its first ISAC report in April 2025 with 18 use cases and six sensing modes. 3GPP wrapped its Release 19 sensing study a month later, 32 use cases in TR 22.837, and TR 38.901 extended to cover the ISAC channel. The 6G native version lands around 2030. The only decision available to you today is whether the network you are building right now will be ready when it does.
Peel the rug
Static geometry is the thing every game engine already knows to cache.
A radio echo from an entire landscape is mostly useless, because hills and houses reflect constantly and they look identical today and yesterday. So you subtract them.
Learn the static scene once. Everything that never moves. Keep it. When a new echo arrives, subtract the static half, and whatever is left over is the thing that changed. A rain cell. A flood front. A drone over an airport.
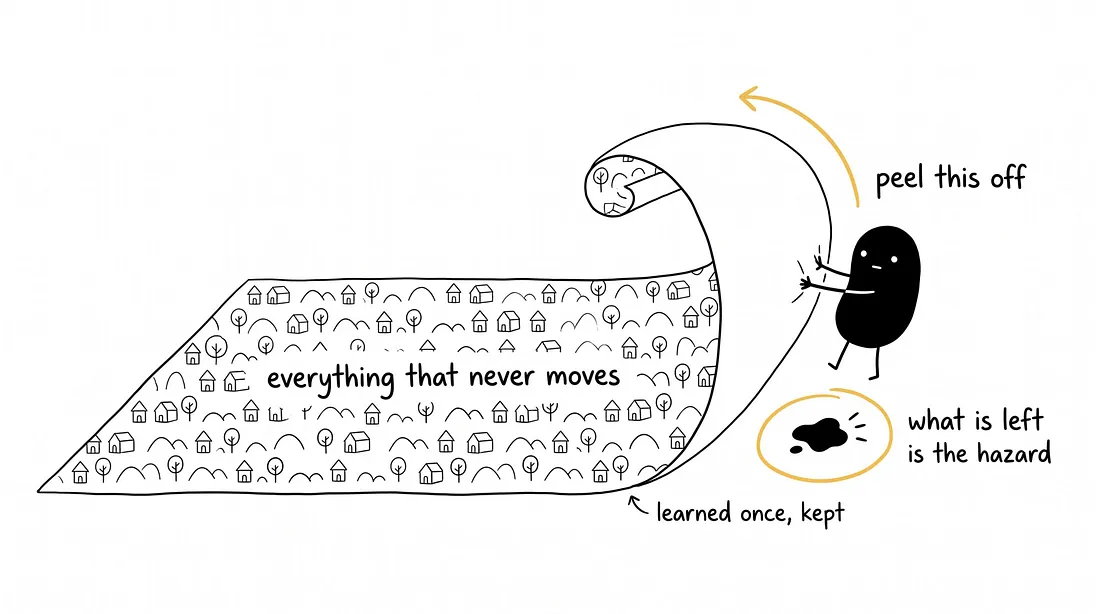
Remember this one. It turns out to be the hinge of the whole project, because building an accurate background for a real place, with real geometry, is the part we actually finished.
Barbados, at building resolution
166 square kilometers. About 280,000 people. 130,248 individual building footprints.
That last number is why we started there. A country that size is small enough to model at full fidelity and complicated enough that nothing about it is a toy. It is the difference between a tech demo and a place.
Everything in the twin comes from one authoritative source, which is 19 ESRI shapefiles from the Barbados Geoportal at the Lands and Surveys Department. Native coordinate system EPSG 21292, the Barbados 1938 British West Indies Grid. We re-project to 4326 for the web and deliberately keep 21292 for propagation, because ray lengths have to be in true meters and nothing ruins a physics result faster than a sloppy datum.
Alongside the buildings there are 17,966 water mains, 17,802 segments of potable network, 705 roads, 100 antennas, 111 major projects, and four vulnerability grids at 13,029 cells each.
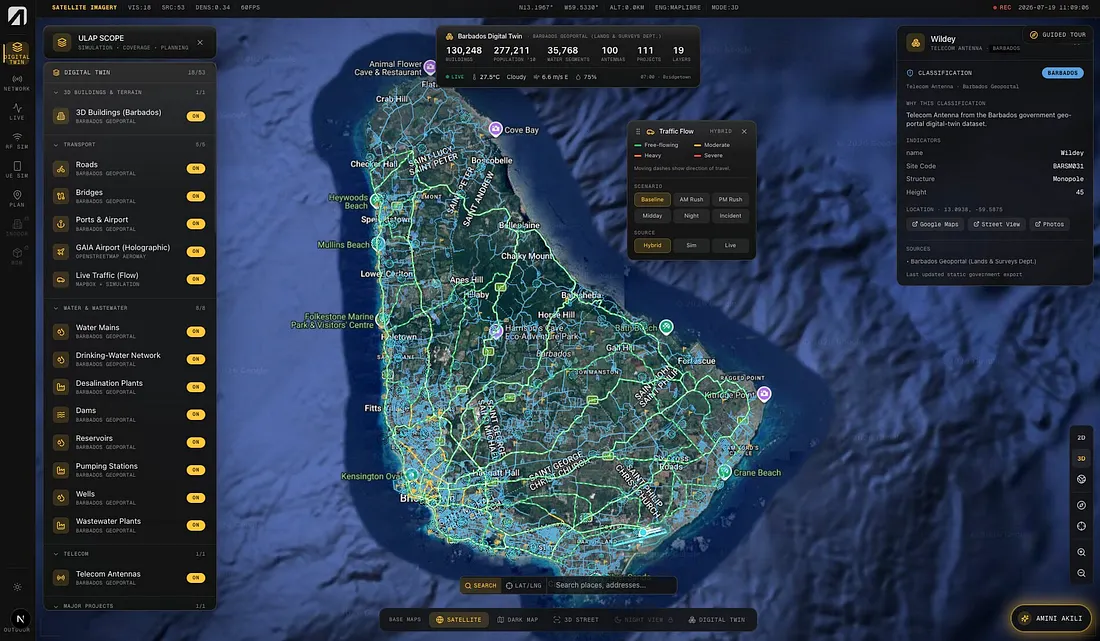
The first time that rendered I sat back from the laptop and just looked at it for a while. It is a whole country, with its water in it.
Zoom in and every asset carries provenance and hazard attributes, not just geometry. Critical assets carry return period fields for rainfall, coastal flood, landslide and seismic, which is what lets you join an asset to a climate risk model instead of eyeballing it next to one on a slide.
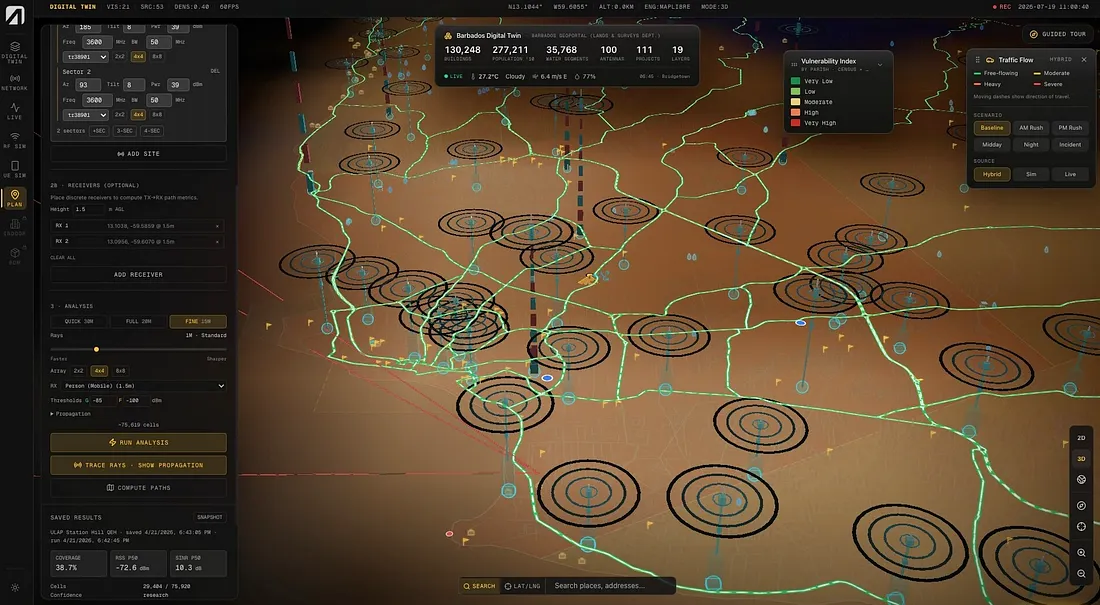
Planning mode. Per sector RF config propagated with a 3GPP TR 38.901 model over the national infrastructure and the parish vulnerability surface. 38.7 percent coverage, -72.6 dBm median received signal, 10.3 dB median SINR across roughly 75,619 cells. Those concentric rings are the same radio infrastructure that would one day carry the sensing.
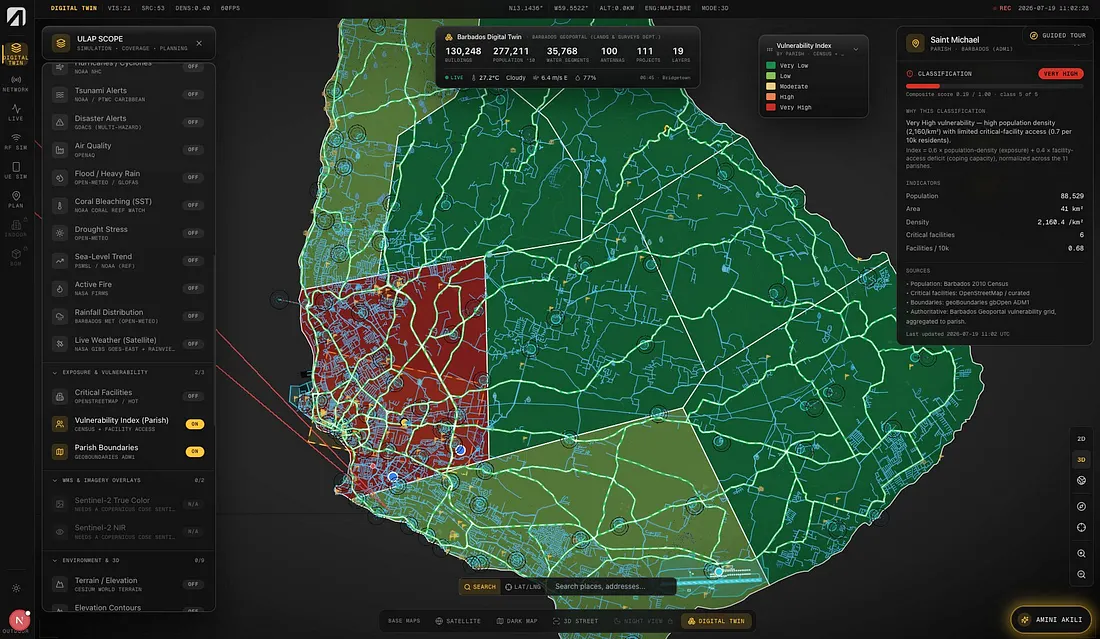
Saint Michael grades Very High. Composite 0.19 out of 1.00, class 5 of 5. Population density 2,160 per square kilometer, population 88,529, and 0.68 critical facilities per 10,000 residents.
That last figure is the one that keeps me up. Not the density. The 0.68.
Press enter or click to view image in full size
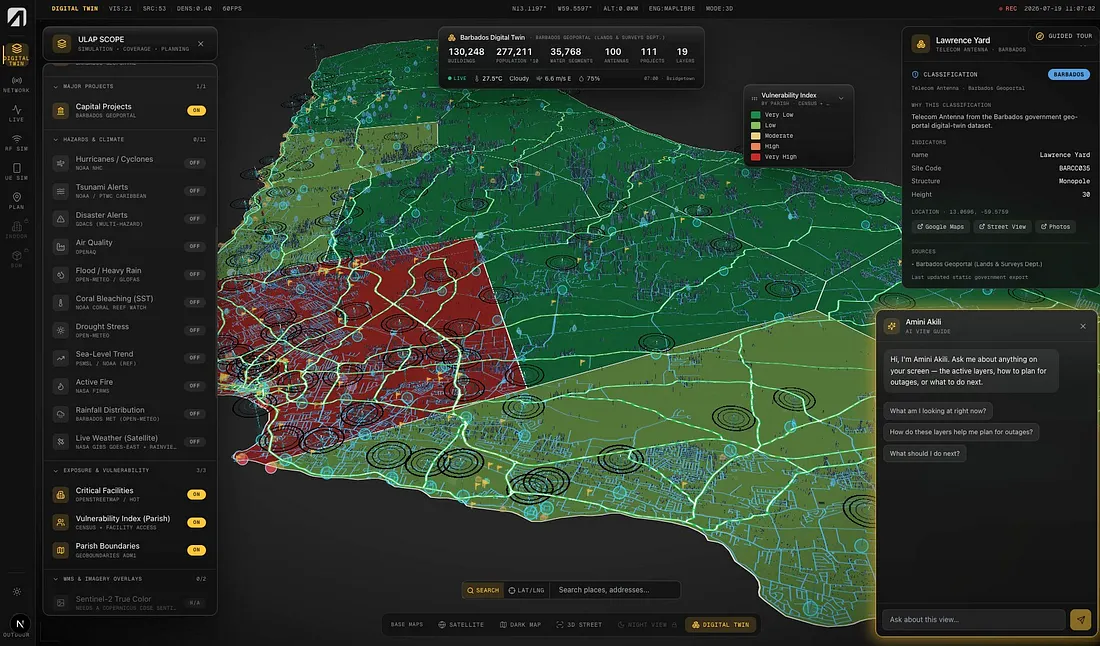
And because a twin only a GIS analyst can drive is not a national capability, there is a generative assistant living inside the map. We call it Amini Akili, which is “brain” in Swahili, our fine-tuned LLM that serves as an AI assistant in our workflows.
You ask it about the view in front of you and it answers from the layers actually loaded, which is a much harder engineering problem than it sounds and a much less impressive demo than a chatbot that will confidently make things up.
Press enter or click to view image in full size
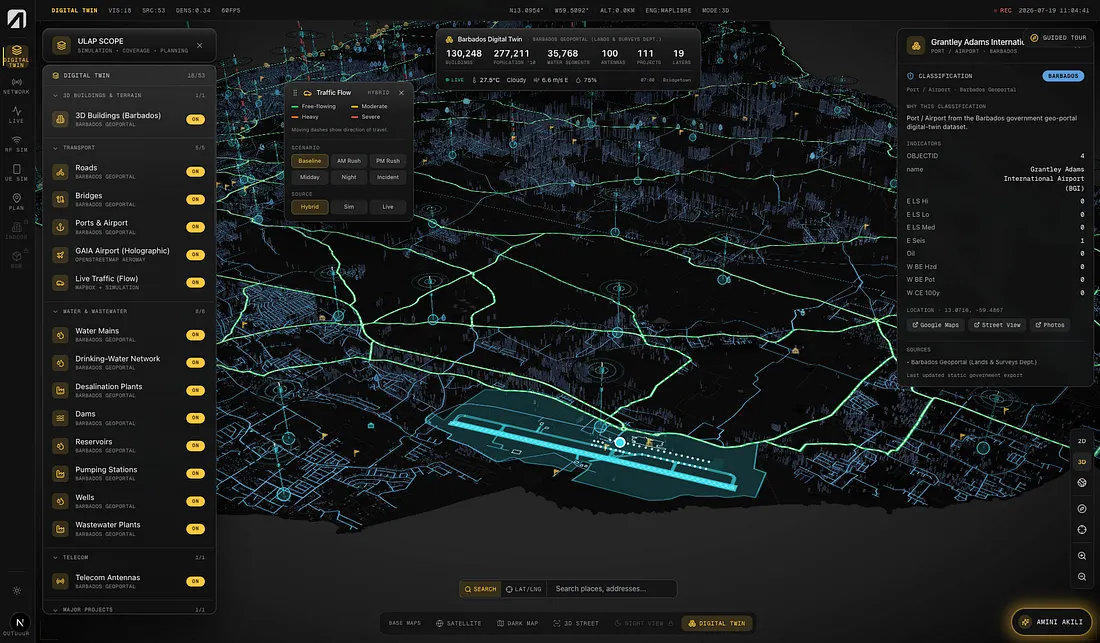
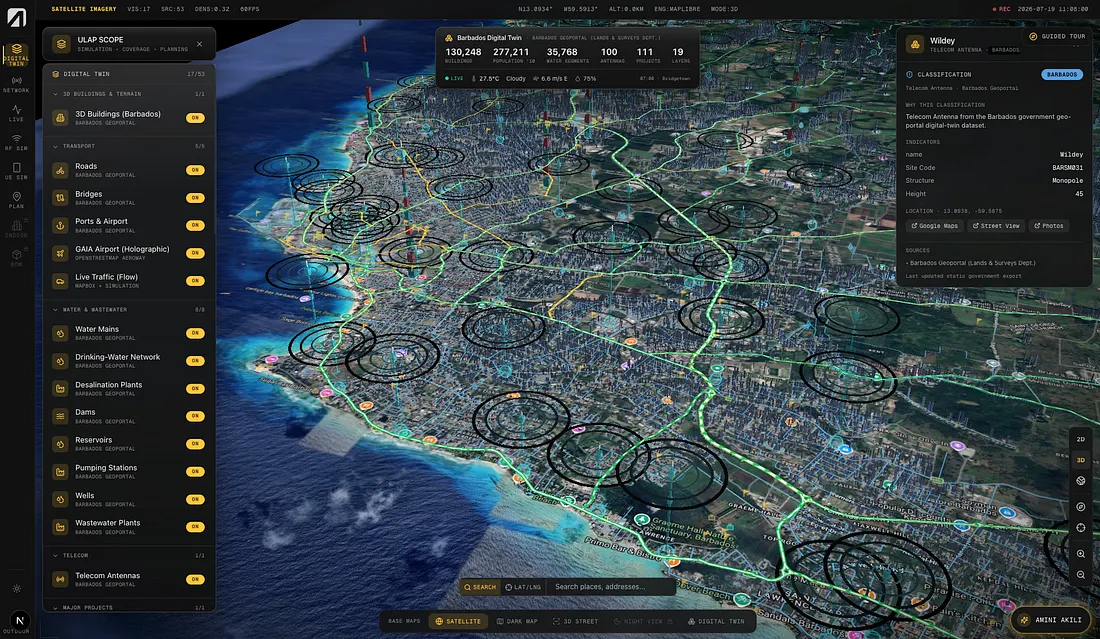
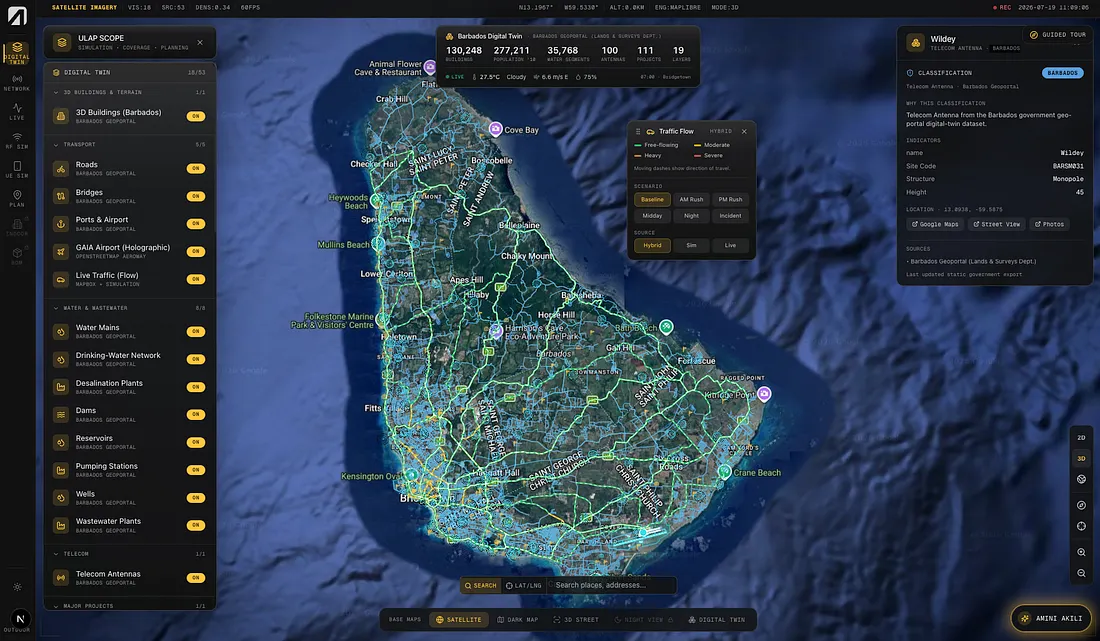
The floating city incident
Sixty meters in the air. Every single tower.
Some context. I am not an RF engineer. One of my co-authors George is, and the division of labour on this project was supposed to be clean, where he handles the RF and radio, and I handle the digital twin. What actually happened is that we both had to go learn the other person’s tools, badly, at speed.
Which is how I ended up learning Blender. Blender, the thing people make animated short films in. I needed it because building a ray tracing scene means taking government building footprints, extruding them to their measured heights, and draping the whole lot over real terrain, and Blender with the GIS add-on is genuinely the sanest way to do that. So there I was, a person whose job title says platforms, watching tutorials from teenagers about vertex normals.
First full solve, I was thrilled. Coverage map came out. Colors and everything. I sent it to George and Tai.
.webp)
He replied with one line asking why the transmitters were flying.
The building heights and the ground elevations were in two different vertical references **sigh**, so the whole tower set had been seated on a surface that did not exist. Barbados had cell sites hovering serenely above the island like a Ghibli sky city. And the coverage map looked completely plausible. That is the part that stayed with me. It was a beautiful, smooth, confident, entirely fictional picture of radio.
The revenge came later, when George sent back a result and asked me to sanity check the RMS delay spread, and I had to go and quietly find out what that was before replying. We are even.
There is a real lesson in there and it is not “be careful with datums”, although, yes, be careful with datums. It is that a wrong simulation does not look wrong. It looks great. Half of the engineering effort on this project went into building the checks that make the model tell on itself, and the tests and the manifests are in the repo for exactly that reason.
What the radio actually said
We cannot put ISAC hardware on Barbados. So we simulate the physics properly against the real island instead of some generic textbook scene. Clip a 2 kilometer study area around Newton Plantation in the Barbados Heritage District. Extrude 576 building footprints to their LiDAR measured heights. Interpolate a 70 by 70 terrain grid from real elevations running 54.7 to 110.3 meters, so around 55 meters of relief. Seat the masts from the August 2023 national antenna register at their true ground elevations, this time. Solve in Sionna RT, 10 million samples per transmitter, depth 5, 5 metre cells.
CPU only. Mitsuba LLVM backend, no CUDA, no cloud account. That is not a performance choice and I will get to why.
Higher frequency buys detail and costs reach
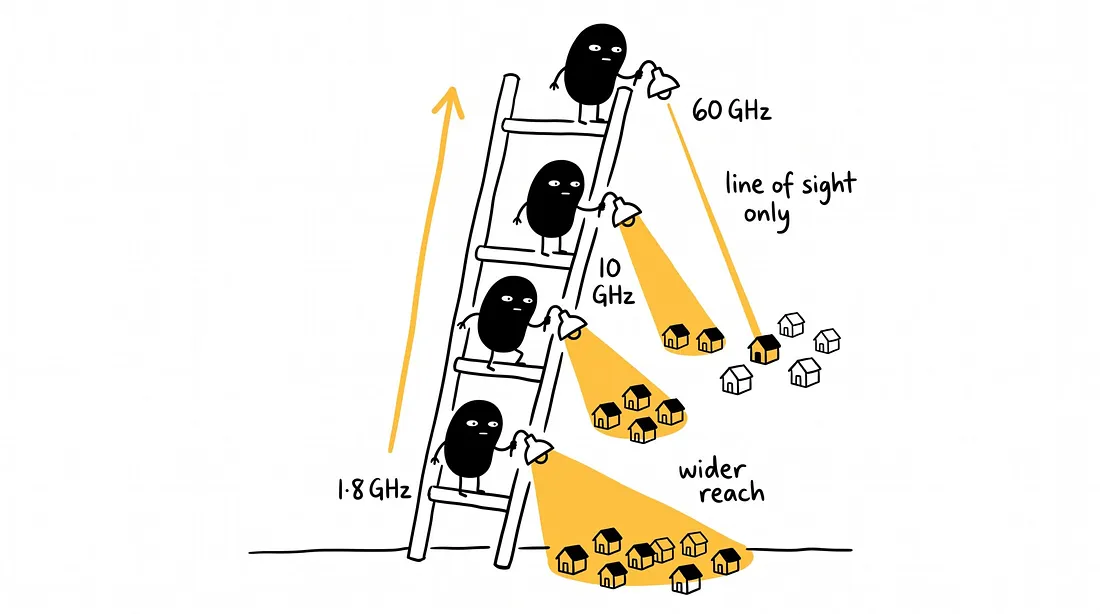
Every rung up the ladder you see more and reach less. Here is the same trade as evidence, on identical geometry.
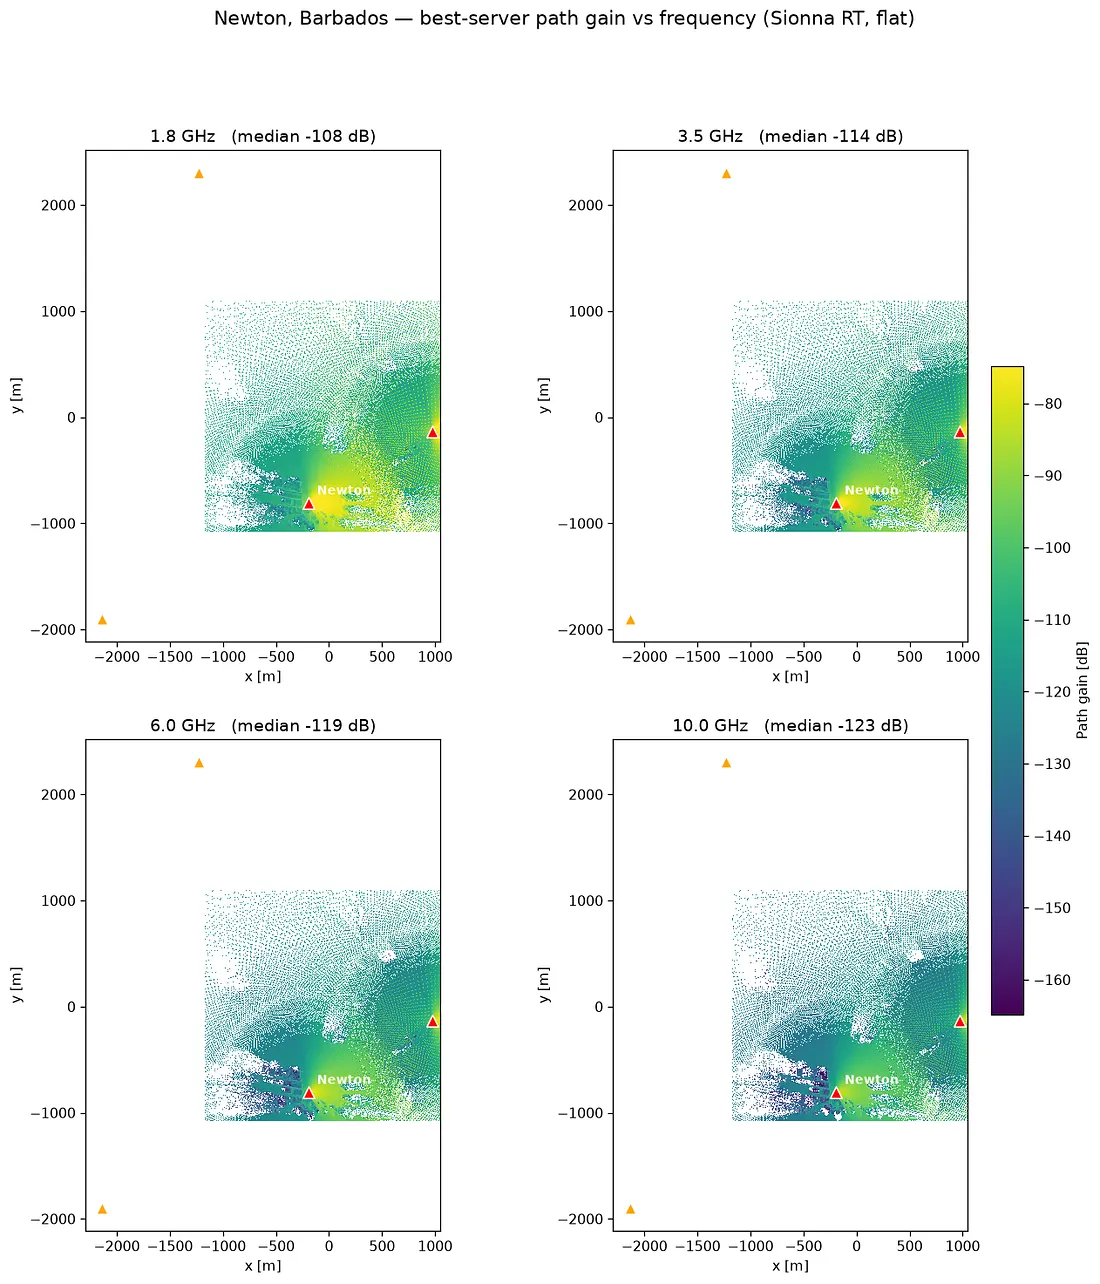
Signal is in dB and more negative means weaker. Median best server path gain falls from -108 dB at 1.8 GHz, to -114 at 3.5, to -119 at 6.0, to -123 at 10 GHz. Fifteen dB gone, most of it swallowed by line of sight lobes closing in around the masts.
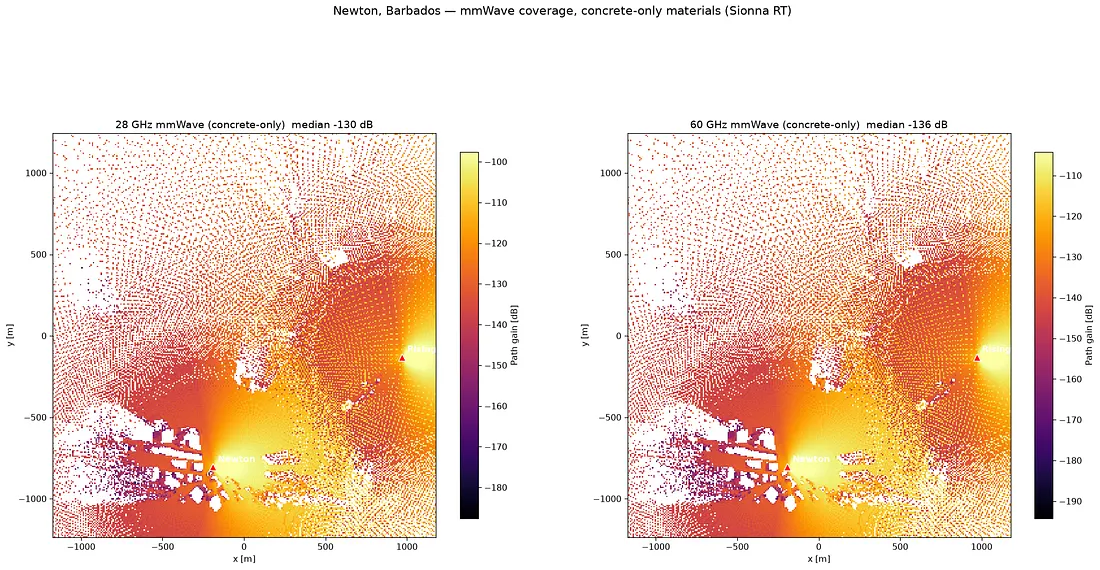
Push into millimeter wave and it turns brutal. Median path gain of -130 dB at 28 GHz and -136 dB at 60 GHz, and useful coverage shrivels to fingers of line of sight around each mast.
Look at the label though. Concrete only. We stop the mixed ground and concrete study at 10 GHz because that is where the ITU medium dry ground model stops being valid, and labelling the wall felt more useful than quietly driving through it and reporting the numbers on the other side.
Terrain is not a detail
This pair is what I would put in front of a regulator, and it is the most useful thing in the paper.
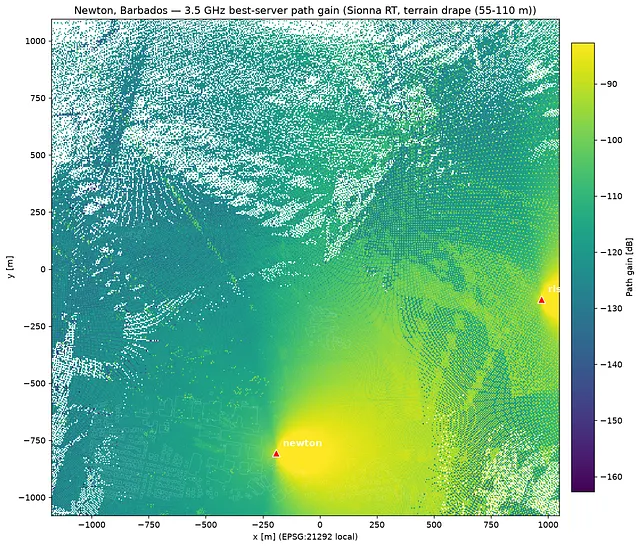
Same place, same towers, same frequency.
The left one samples signal on a flat horizontal sheet, which is the industry shortcut and what most planning tools hand you. The right one follows the actual ground at head height, the way a person holding a phone experiences it, assembled from nine receiver planes across the 55 meters of relief.
The right map resolves ridge shadows that the left map is physically incapable of representing.
Plan from the flat version and you will tell a valley it has coverage, with total confidence, when it does not. Somebody lives in that valley.
More towers is not automatically better
Press enter or click to view image in full size
Four towers at 35 dBm per sector, 100 MHz, each patch of ground coloured by whichever mast serves it best. The boundaries are handover.
Where two towers overlap at similar strength they interfere, so you get pockets of bad service sitting inside nominally good coverage, west of Newton and Rising Sun. Tuning problem, not a coverage hole, and invisible unless your geometry is this explicit.
The transect says the same thing numerically. Path gain falls from -98.9 to -123.8 dB between 50 and 1350 meters, and a third building reflected path produces 361 nanoseconds of RMS delay spread at 450 meters. Which, as established, I had to look up.
.gif)
For a phone call that multipath is a nuisance. For sensing it is the entire signal.
Six layers, one spine
Provenance is the only part of this architecture I would fight someone over.
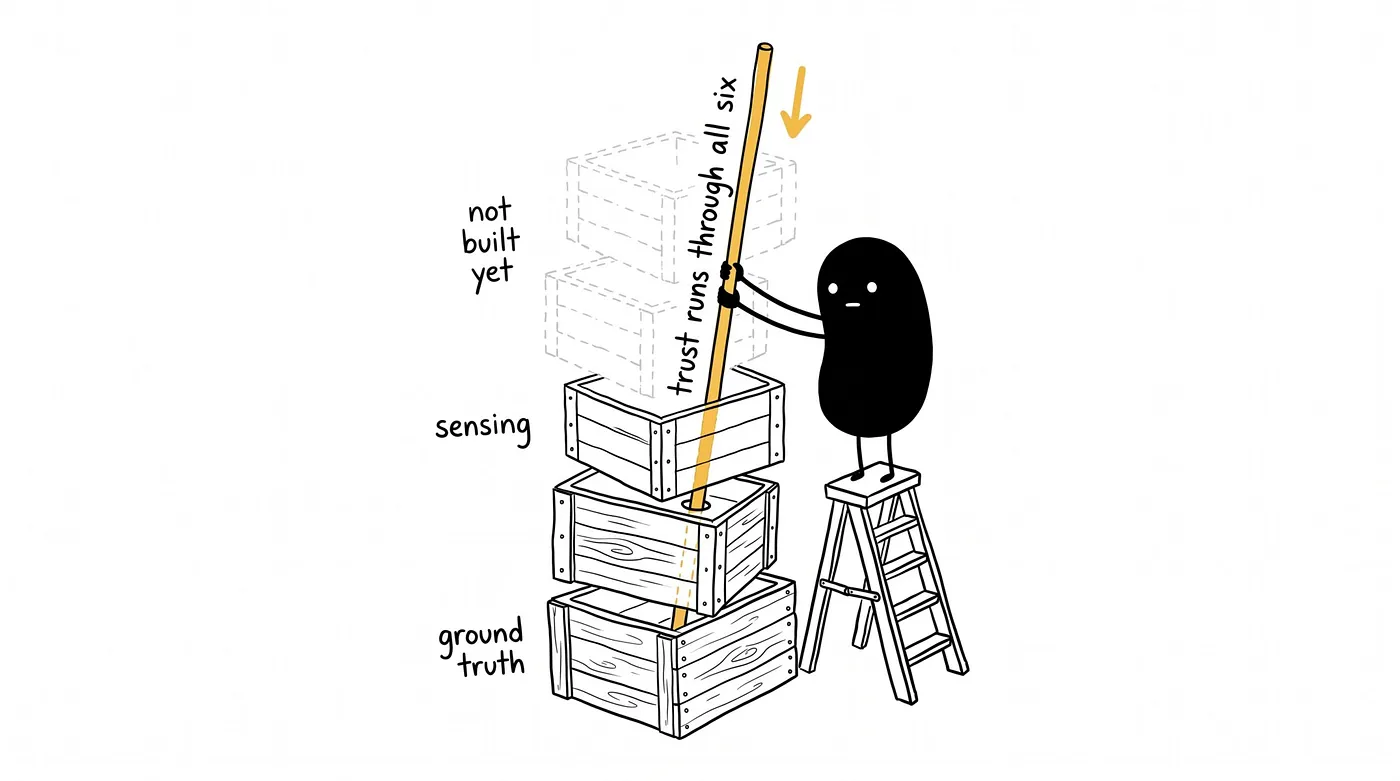
The stack goes geospatial ground truth, systems of record, dynamic data, simulation and surrogates, a synchronisation engine, and the interaction surface people actually touch. Six layers, and honestly, the layers are the boring part.
The vertical trust spine running through all of them is not.
If a digital twin is going to justify evacuating a town, or underwrite a climate finance instrument, then “the dashboard said so” is not a defense. Every number has to carry its origin. Which government dataset, collected when, transformed how, and degraded to what fallback if the good source was missing.
A digital twin without provenance is a very expensive opinion.
Enforced today. Source attribution on every response, CRS enforcement, null and degenerate geometry drops, non finite sanitization, and labelled graceful degradation. If the authoritative government vulnerability grid is missing, the service falls back to a census derived parish proxy and tells you it did, rather than handing you a worse number with a straight face.
Not there yet. SHA-256 content hashing per cube, on chain node attestation, and a cryptographic admission gate. That is the next work item and it is the difference between a twin that informs and a twin whose outputs are finance grade and evacuation grade.
Acting on information that is always slightly out of date
Every reading you are holding is a picture of the past.
O-RAN telemetry reaches a controller up to about 100 milliseconds late. For a phone call that is nothing. For a system steering beams at a fast moving hazard field it is the whole problem.
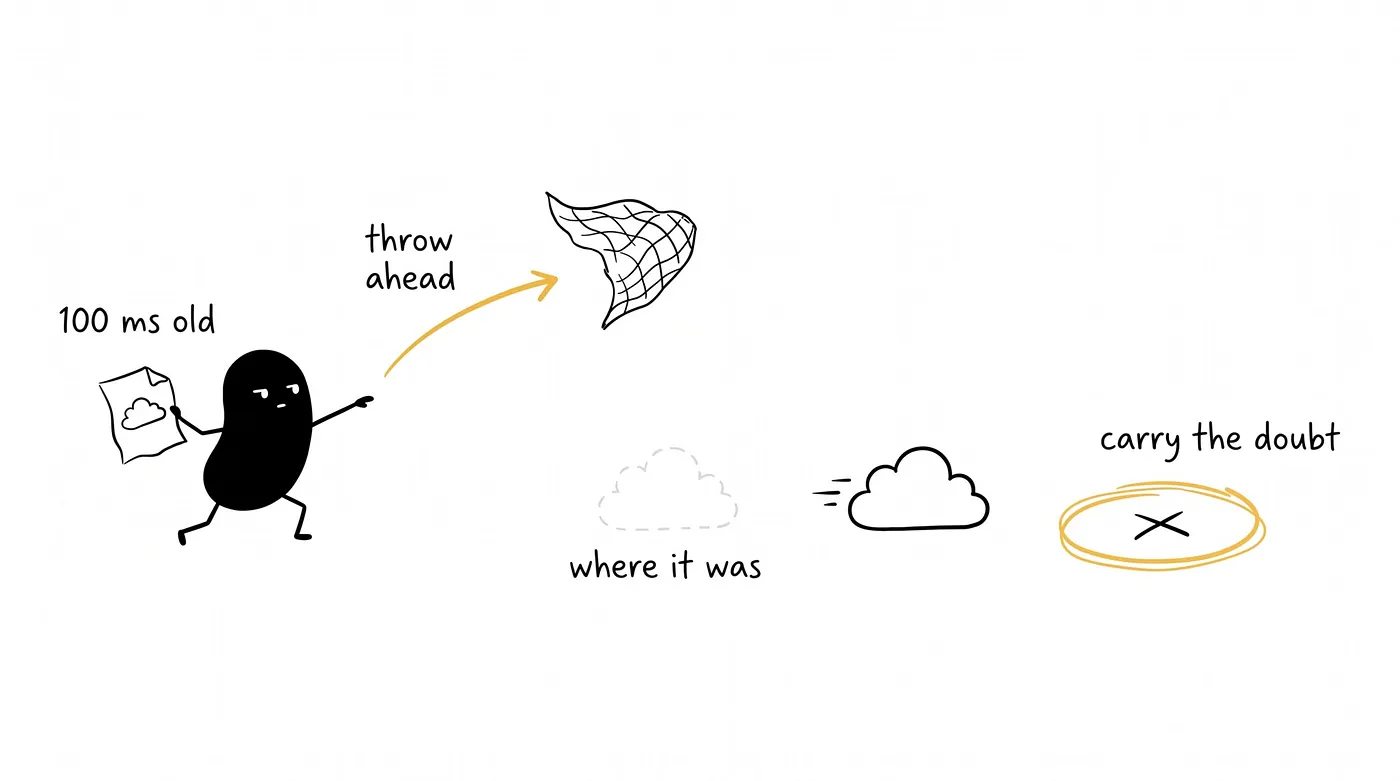
Chasing the readings does not work. What works is keeping a running estimate of the current state plus an honest measure of how unsure you are, then deciding on the pair. Engineers call it a belief state. In the paper, it is an Extended Kalman Filter fusing the delayed observation against a correspondingly retrodicted state, carrying the covariance explicitly into the decision.
In practice the system can tell the difference between “the flood front is here” and “the flood front is probably here, give or take 200 meters”, and behave differently. Anyone who has run an evacuation knows those are not the same sentence.
Above the estimator sits the part that will look familiar if you build RAN intelligence for a living. Training runs as federated learning across sites so raw observations stay local. The Non-RT RIC hosts the twin models and the policy learning, the Near-RT RIC executes low latency control as an xApp, handling beamforming power, dwell and scan allocation, and mode selection across the six sensing modes. The policy is a PPO agent mapping belief state to actions, with a reward trading sensing accuracy against throughput while penalizing energy and residual security risk. Active hazard, shift resource toward tracking. Nominal conditions, favor throughput. And because multi static sensing produces point clouds that will happily saturate a rate limited emergency backhaul, an autoencoder at the gNodeB compresses observations before they cross the link.
Two constraints that are political, not technical
1. It has to work when the cable gets cut
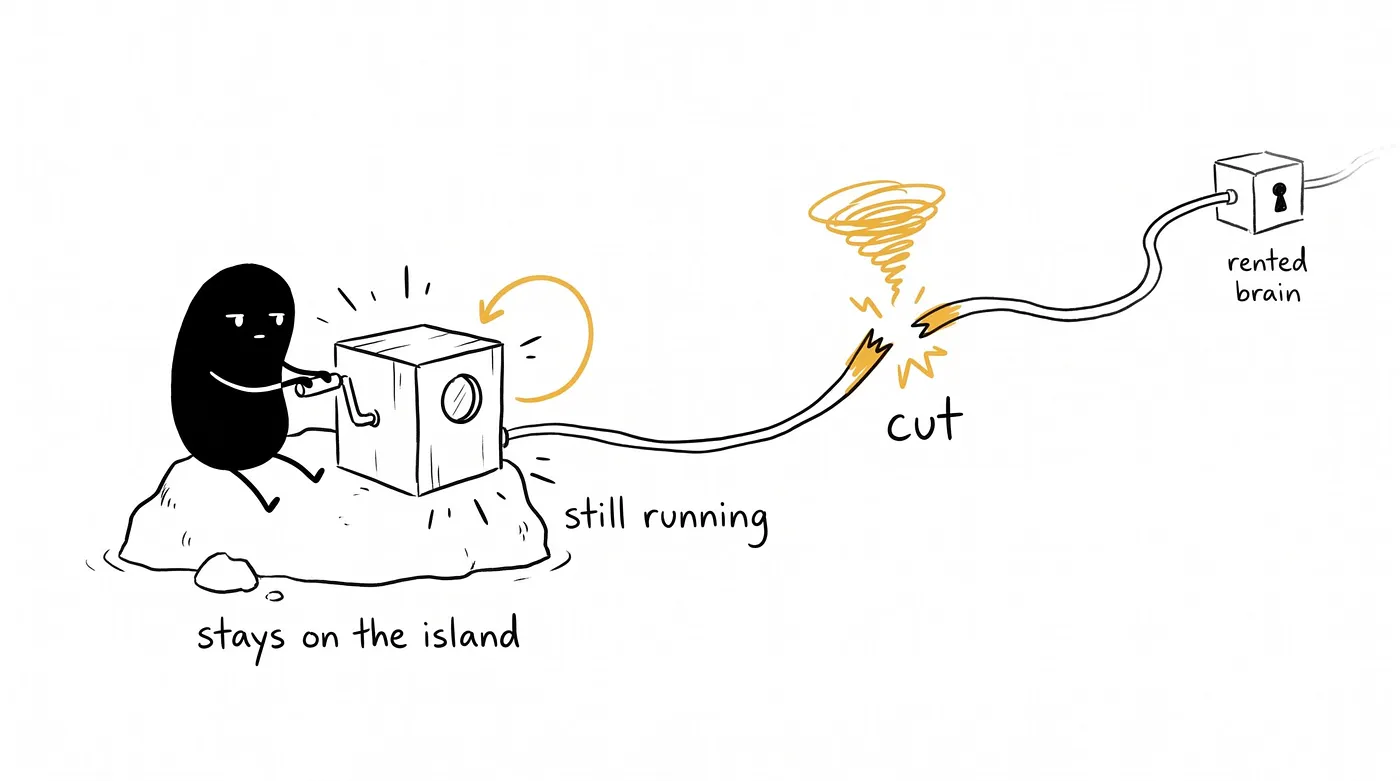
A hurricane is precisely when a small island loses international connectivity. So a digital twin running on rented compute in somebody else’s jurisdiction goes dark at the exact moment it exists to serve. That is a spectacular way to fail and it is not hypothetical.
The second reason has nothing to do with resilience. A digital twin like this learns intimate things about a country. Where people are. Which buildings are weak. Where the water goes when it rains. Those weights and that telemetry belong under the country’s own law, not under a terms of service document nobody in the ministry has read.
So the constraint is on territory hardware, ordinary processors, no cloud dependency, no GPU requirement. That is why every propagation result above ran on CPU.
A nation cannot hold sovereign control of a capability it cannot itself run. I would put that on a wall.
2. The same signal that maps a hill can watch a person
Skipping this part would be cowardly, so here it is.
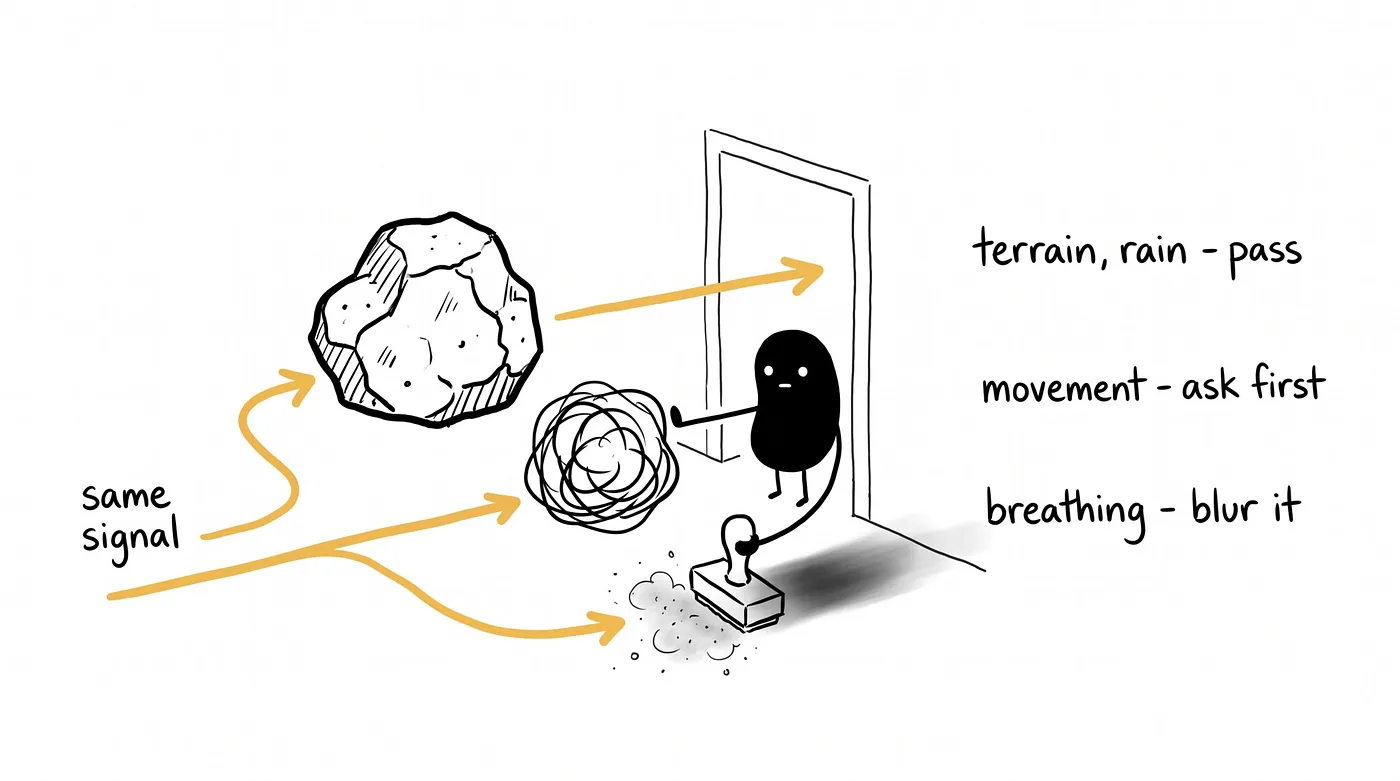
A waveform fine enough to map terrain is, at higher resolution, fine enough to detect that somebody is breathing, or how they walk. The exact property that makes this useful for floods makes it a surveillance instrument. Both things are true at once and pretending otherwise is how you end up building something you cannot defend.
Following Günlü et al., the paper sorts what the network can perceive into three tiers and gates them at the boundary.
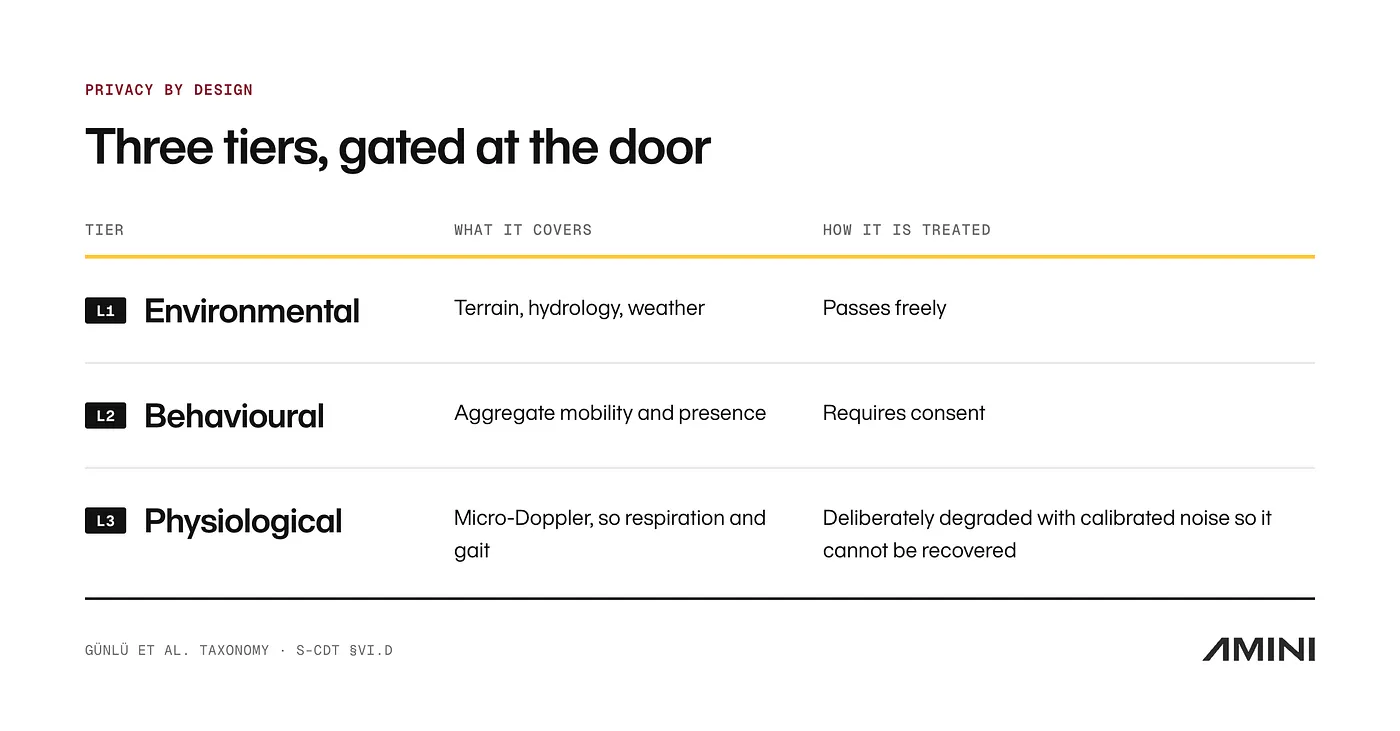
That is a design target and not a guarantee. Working out the leakage bound for a given noise distribution, and measuring the privacy versus sensing utility curve, is future work.
What we built
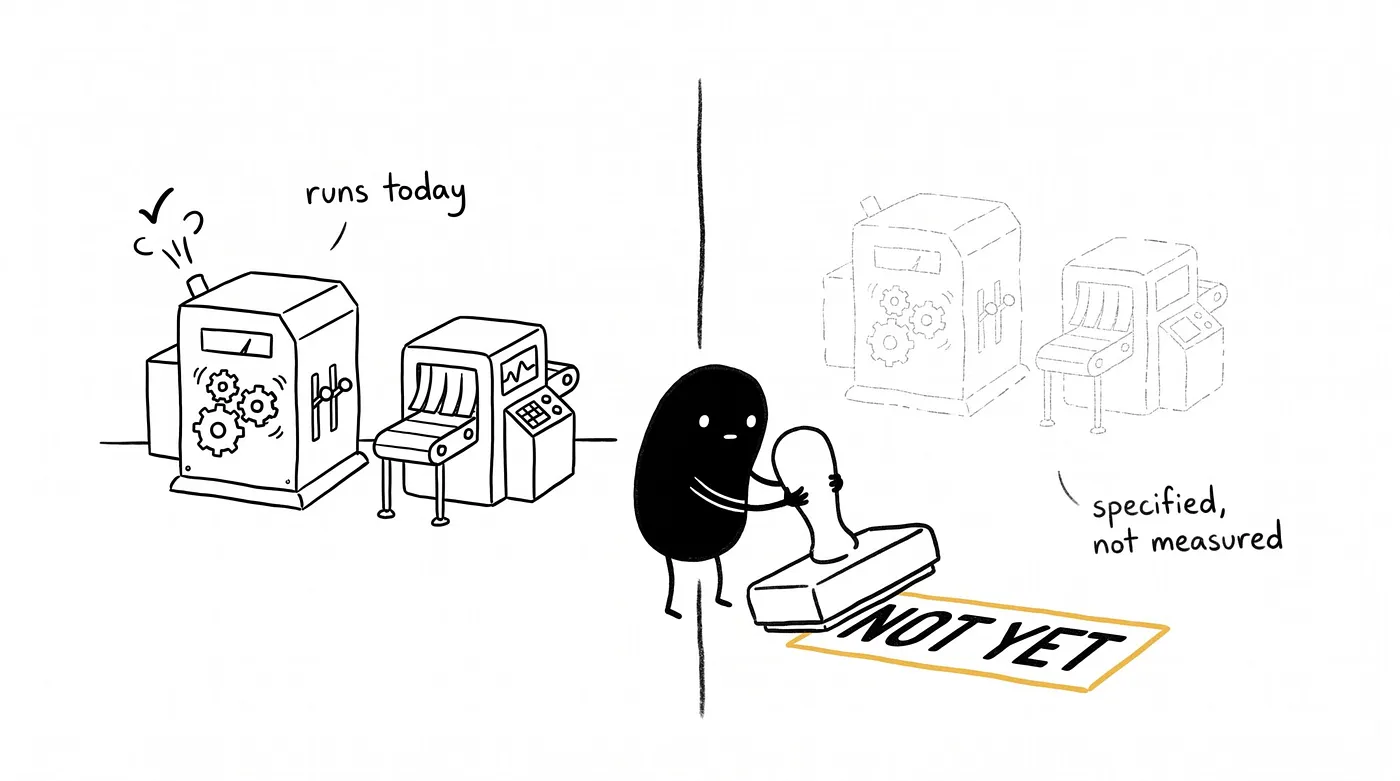
Papers in this area have a habit of describing a design in the present tense until the reader quietly assumes it is running. We went through ours claim by claim to stop that.
Runs today:
- The idempotent ingest and serve pipeline over 19 authoritative government layers
- GeoPackage plus PMTiles, with a catalogue manifest that doubles as a provenance ledger
- Typed live connectors, one documented ingress per source
- The Ulap Scope app, so 3D island rendering, per parish vulnerability, asset inspection, and the in map assistant
- The full CPU only deterministic propagation workflow, with automated tests
Specified but not built:
- The ISAC feed itself. There is no ISAC hardware in Barbados.
- The Extended Kalman Filter belief state estimator
- The PPO orchestrator and the AI-RAN closed loop
- Content hashing, on chain attestation, the cryptographic admission gate
- L2 and L3 privacy gating, because only L1 is served today so there is nothing yet to gate
Against the usual maturity ladder of descriptive, diagnostic, predictive, prescriptive, autonomous, the deployed twin sits at descriptive and diagnostic. The ray tracing adds an uncalibrated predictive rung. Nothing is autonomous.
The propagation numbers are simulated and not field calibrated. The antennas are 1 by 1 V polarized. No vegetation, no rain in the material model.
We think that gap is the contribution.
Why this travels, and why I care
7,641 islands, and the weather gets a vote in all of them.
The Philippines shows up in the paper as the archipelagic generalization, and not because it is where I am from. Inter-island non-terrestrial sensing and edge autonomy stop being nice to have across that geography and become the entire design. Barbados is the bounded, high fidelity reference. The transfer path is deliberately boring. Swap the government source, re run the ingest and governance pipeline.
The workflow, the pinned environments, the manifests, the figure scripts, the CPU reproduction instructions, all of it ships with the paper. So another small island state, another ministry, another team of four in Suva or Praia or Port Vila can point this at their own national data and get to the same rung in weeks instead of years. You do not need a supercomputer. You do not need a cloud account. You need your country’s own geospatial export, a laptop, and a willingness to try.
Here is what I keep thinking about, and it is the internet cafe again.
The kid I was could not run a simulation. She could only read about one, twenty pesos at a time, on a machine somebody else owned, in a province where the rivers were still deciding where to go after a volcano rearranged them. What we are building is not really a twin. It is the thing that lets a country run its own simulation, on its own hardware, about its own ground, and keep the answer.
If you work anywhere near this, in climate services, telecoms regulation, national GIS, disaster management, or you just like building worlds, feel free to try it out.
The paper is on arXiv. The code is on GitHub.
Go try it and give us feedback!
Read next
The paper is Sovereign Cognitive Digital Twins, Fusing 6G ISAC, AI-RAN, and Zero-Trust Edge Grids for National Resilience in the Global South, by Cayetano, Gichuru and Morris at Amini. arXiv:2607.28756 [cs.NI].
Code and reproduction artifacts are at github.com/aminitech/aminiulap-digital-twin, Archived at Zenodo DOI 10.5281/zenodo.21708211, and please cite the DOI rather than the repo URL.
The earlier work on this thread is SIDSense, Database-Free TV White Space Sensing for Disaster-Resilient Connectivity, by Gichuru and Cayetano, at arXiv 2602.13542.
References
- UNDP Climate Promise, “Small Island Developing States are on the frontlines of climate change”
- World Economic Forum, “How Barbados is using data and technology to build climate resilience”, 2023
- Centre for Digital Built Britain, National Digital Twin Programme
- Bolton, Enzer, Schooling et al., “The Gemini Principles”, CDBB and Digital Framework Task Group, 2018
- GovTech Singapore, “5 things to know about Virtual Singapore”
- European Commission, Destination Earth
- Ericsson, “Integrated Sensing and Communication explained”
- ETSI, “ETSI publishes first Report on ISAC Use Cases for 6G”, GR ISC 001, April 2025
- 3GPP TR 22.837, “Feasibility Study on Integrated Sensing and Communication”, Release 19
- 3GPP TR 38.901, “Study on channel model for frequencies from 0.5 to 100 GHz”, ISAC extensions, Release 19
- ITU-R Recommendation P.838, “Specific attenuation model for rain for use in prediction methods”
- Günlü et al., “ISAC Privacy, Challenges and Solutions for 6G”, 2026
- Keskin et al., “Multi-Domain Security for 6G ISAC”, 2025
- Tiwari et al., “Digital Twin-Assisted Belief-State Reinforcement Learning for Latency-Robust ISAC in 6G Networks”, 2026
- Pan et al., “Observation Compression in Rate-Limited Closed-Loop Distributed ISAC Systems”, IEEE Globecom Workshops, 2025
- Government of Barbados, Barbados Geoportal, Lands and Surveys Department
The underlying geospatial data is the property of the Government of Barbados, obtained from the Barbados Geoportal at the Lands and Surveys Department, and is not redistributed.
We thank the Ministry of Industries, Innovation, Science and Technology and the Lands and Surveys Department for supporting this work. The interpretations and any errors are the authors’ own and do not represent the position of the Government of Barbados.

Blog


.avif)
